
In 2024, making smart investment decisions has never been more crucial, especially with the volatility that characterizes global markets. Over the past few years, the volume and complexity of data available to investors have exploded, and this has revolutionized how we approach investing. Whether you’re an individual investor or a professional portfolio manager, understanding and utilizing big data is now a fundamental part of the investment process.
I’ve often found myself lost in a sea of numbers, charts, and market reports, feeling overwhelmed by the amount of data out there. But as I’ve grown as an investor, I’ve learned how to harness this information using advanced data analysis tools. These tools help me make informed decisions, reduce risks, and identify potential opportunities that I may have missed otherwise. In this article, I’ll walk you through how I use big data and the best investment data analysis tools available today to make smarter, more strategic decisions.
The Power of Big Data in Investing
Big data in investing refers to the vast amounts of structured and unstructured data that can be analyzed to reveal insights about market trends, stock performance, company financials, economic indicators, and investor sentiment. This data can come from a variety of sources, including financial statements, social media, news articles, and even satellite imagery. The beauty of big data is that it allows investors to spot trends and make predictions based on a far more comprehensive understanding of the market than what was previously possible.
For example, I often use sentiment analysis to gauge how the market feels about a particular stock or sector. By analyzing millions of social media posts, news articles, and other forms of public communication, these tools can provide real-time insights into market sentiment, helping me determine whether to buy, sell, or hold.
Incorporating big data into my investing process has allowed me to make smarter, more data-driven decisions. Gone are the days of relying solely on gut feelings or the opinions of pundits. Big data analysis empowers me to make decisions based on real, actionable insights.
Key Investment Data Analysis Tools I Use
There are several tools available that help me analyze big data and make informed investment decisions. These tools come with various features, ranging from real-time stock tracking to sentiment analysis, financial modeling, and predictive analytics. Let’s take a look at some of the most useful investment data analysis tools I rely on.
1. Bloomberg Terminal
The Bloomberg Terminal is one of the most widely used tools by professional investors and analysts. It offers access to a comprehensive database of financial information, including real-time data on stocks, bonds, commodities, and currencies. It also includes powerful analytics tools that allow investors to track market trends, analyze financial statements, and access breaking news.
I rely on Bloomberg Terminal for its unparalleled access to global financial data, but what sets it apart is its analytical capabilities. I can quickly assess the financial health of companies and create custom reports to track my investments.
2. Morningstar Direct
Morningstar Direct is another indispensable tool in my investment arsenal. It’s a comprehensive platform that provides performance data, research reports, and in-depth analysis on mutual funds, ETFs, and stocks. The platform is particularly useful for its detailed analysis of fund managers and their strategies, as well as the ability to assess the risk and return profile of different investment options.
What I appreciate about Morningstar Direct is its ability to help me compare investment options across various metrics, like fees, performance, and risk. It’s especially helpful for building a diversified portfolio by providing data that can guide my decisions on asset allocation.
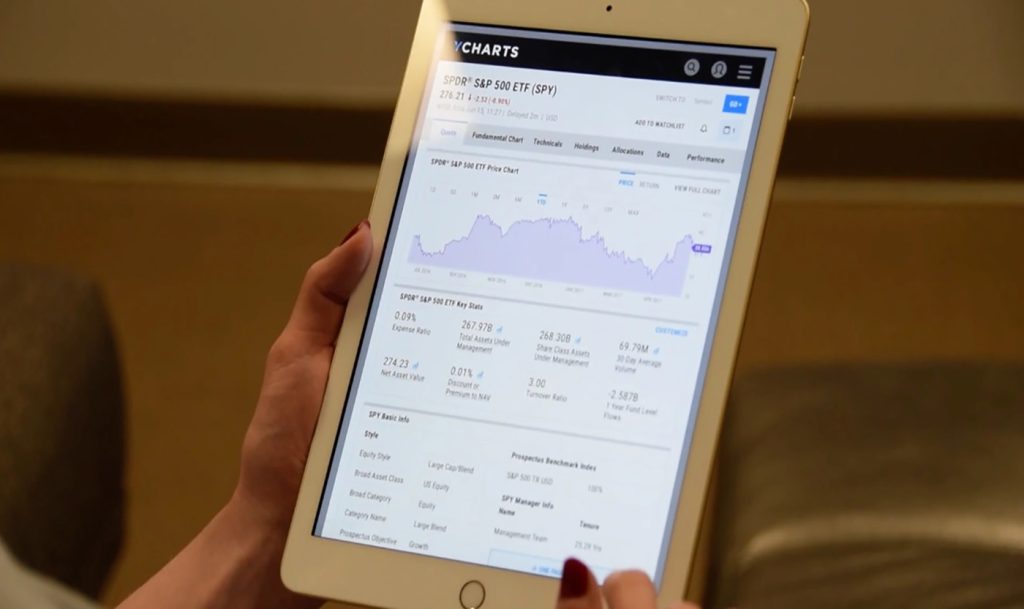
3. YCharts
YCharts is an investment research tool that provides powerful data visualizations and analytics for a wide variety of financial instruments. It allows me to create custom charts and models to track performance, measure volatility, and analyze correlations between different assets. One of the standout features of YCharts is its ability to break down financial statements in a way that makes it easy to spot trends and anomalies.
I use YCharts to analyze stock performance over time, particularly when I need to drill down into granular data like earnings growth, revenue trends, and profitability ratios. It’s a great tool for value investors looking to find undervalued stocks.
4. Sentiment Analysis Tools (e.g., StockTwits, Accern)
Sentiment analysis tools help investors understand the mood of the market by analyzing social media, news articles, and other forms of public communication. StockTwits, for instance, tracks social media posts about specific stocks and provides sentiment scores based on the language used by investors. Accern, on the other hand, analyzes news articles and other textual data to gauge market sentiment and provide real-time alerts on stocks.
Using sentiment analysis tools has become a game-changer for me, especially in volatile markets. They help me understand how other investors feel about a particular stock or sector, which can influence my decision-making process. For example, if sentiment is overwhelmingly negative, I might decide to sell off a stock before a potential downturn. Conversely, if sentiment is positive and rising, I may look into buying or holding.
5. FactSet
FactSet is a robust financial data platform that offers a comprehensive suite of tools for financial analysis, risk management, and investment research. It provides access to a vast database of financial and economic data, as well as powerful analytics tools for portfolio management and performance tracking.
What sets FactSet apart from other platforms is its ability to integrate data from multiple sources into one cohesive view. Whether I’m analyzing a company’s earnings, tracking macroeconomic trends, or looking for industry-specific data, FactSet has the information I need to make informed investment decisions.
6. TradingView
TradingView is an excellent tool for charting and analyzing stock price movements in real time. It provides advanced charting tools that allow me to analyze price patterns, identify trends, and forecast potential price movements. TradingView also allows me to share charts and analysis with other traders, which fosters collaboration and learning.
While I primarily use TradingView for technical analysis, I also use it to stay updated on market trends and create custom alerts for stocks that meet my investment criteria. The ability to set price alerts and receive notifications when a stock reaches a specific threshold has been incredibly useful in optimizing my entry and exit points.
How to Use These Tools to Make Smarter Investment Decisions
It’s one thing to have access to these tools; it’s another thing entirely to use them effectively. Over the years, I’ve developed a few strategies for integrating these tools into my investment process, and I’d like to share some tips on how you can do the same.
1. Focus on Fundamentals First, Technicals Second
While tools like TradingView are excellent for technical analysis, I’ve found that the key to making smarter investment decisions is to focus on the fundamentals first. Before diving into charts or sentiment data, I always analyze a company’s financial health using tools like Bloomberg Terminal and Morningstar Direct. If the fundamentals are strong, I then move on to technical analysis and sentiment analysis to identify the best entry points.
2. Use Sentiment Analysis for Early Indicators
Sentiment analysis tools are incredibly valuable when trying to gauge market sentiment early on. By tracking social media, news articles, and investor opinions, I can often identify potential trends before they fully materialize. This has been particularly helpful in high-volatility sectors like technology, where market sentiment can swing dramatically in short periods of time.
3. Leverage Data for Portfolio Optimization
One of the best uses of data analysis tools is for optimizing portfolio diversification and managing risk. Using platforms like YCharts and FactSet, I analyze the risk-reward profile of different assets in my portfolio and make adjustments as needed. These tools allow me to visualize how different assets interact with each other, helping me reduce risk and improve overall performance.

4. Stay on Top of Market Trends
With the pace of market changes, it’s crucial to stay informed about broader market trends. Tools like Bloomberg Terminal and FactSet allow me to monitor economic indicators, interest rates, and macroeconomic factors that can affect my investments. Keeping an eye on these broader trends helps me anticipate shifts in the market and make proactive adjustments to my portfolio.
Data-Driven Investing for the Future
In 2024, the availability of big data has transformed the way we approach investing. By using investment data analysis tools, I can make smarter, more informed decisions based on real-time insights and data-driven analysis. The tools I’ve highlighted in this article have been invaluable in helping me build a more diversified and profitable portfolio.
But remember, data analysis is only one part of the equation. Successful investing also requires discipline, patience, and the ability to stay calm during periods of market volatility. While these tools provide valuable insights, they cannot replace the importance of a well-thought-out strategy and long-term vision.
As an investor, it’s crucial to continually educate yourself, stay updated on market trends, and adapt your strategies as needed. By combining big data analysis with a clear investment plan, you can improve your chances of making smarter, more profitable investment decisions in today’s complex and fast-moving market.


