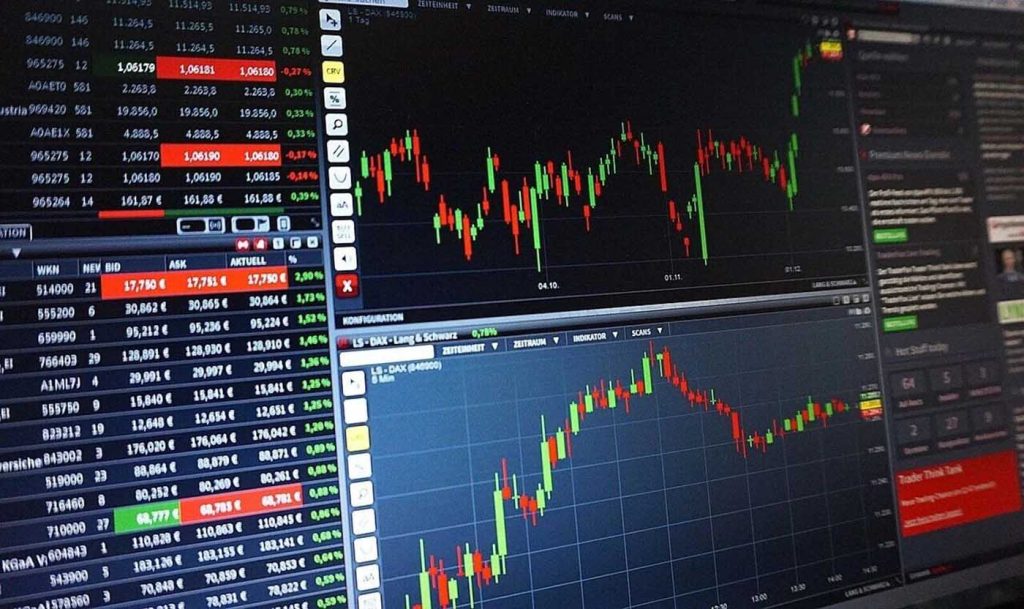
The stock market is often seen as an unpredictable and volatile environment. However, there are tools and techniques that can help investors navigate the chaos and make informed decisions. One of the most widely used methods is technical analysis, which involves studying historical market data, primarily price and volume, to forecast future price movements.
In 2024, as markets become more influenced by global events, technological advancements, and economic shifts, technical analysis continues to be an indispensable tool for investors seeking to predict trends and optimize their strategies. Whether you’re a novice or an experienced investor, understanding how to effectively use technical analysis can give you an edge in the marketplace.
In this article, we will explore how technical analysis works, the key tools and indicators you need to know, and how to apply them to forecast stock market trends. I will also provide practical advice on how to integrate technical analysis into your investment strategy, along with some recommended resources for further learning.
1. What Is Technical Analysis?
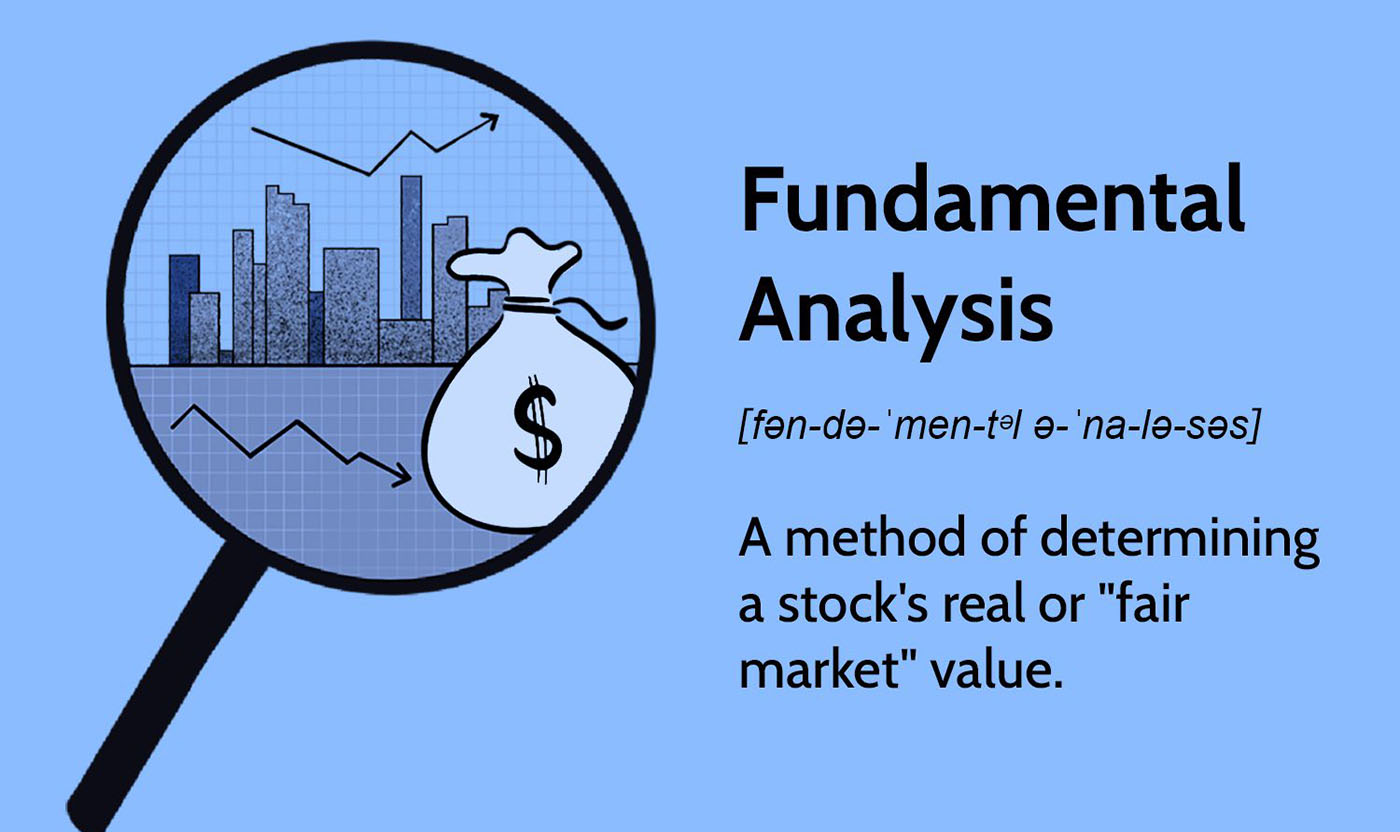
At its core, technical analysis is the study of past market data to identify trends and make predictions about future price movements. Unlike fundamental analysis, which focuses on a company’s financial health, earnings reports, and overall economic environment, technical analysis is purely focused on price action—meaning the historical price movements of a stock, ETF, or other financial asset.
Technical analysts believe that all information, whether public or private, is already reflected in the price of a stock. They argue that prices move in trends and that these trends tend to repeat over time. Therefore, by analyzing past price movements, traders and investors can identify patterns that may indicate future behavior.
One of the key principles of technical analysis is the idea that history tends to repeat itself. This is based on the assumption that investor psychology drives price trends, and human behavior tends to be cyclical, leading to recurring patterns in price charts.
2. Key Tools and Indicators in Technical Analysis
To predict stock market trends using technical analysis, investors rely on a variety of tools and indicators. These tools help identify trends, gauge market sentiment, and spot potential buy or sell signals. Below, I will cover some of the most essential tools and indicators every technical analyst should understand.
2.1 Price Charts: The Foundation of Technical Analysis
The most basic and foundational tool in technical analysis is the price chart. Price charts visually represent the historical price movements of an asset over a specified time frame, allowing traders to see how prices have moved in the past and assess potential future trends. There are several types of price charts, but the most common ones are:
- Line Charts: These charts plot a single line that connects the closing prices of an asset over a certain time period. While they are simple, they provide a clear overview of price trends.
- Bar Charts: Bar charts show the opening, closing, high, and low prices for a given time period, providing more information than line charts.
- Candlestick Charts: Candlestick charts are similar to bar charts but use “candlestick” shapes to represent price action. Each candlestick shows the open, close, high, and low prices for a particular period and can indicate certain market patterns.
Candlestick charts are particularly popular among technical analysts because they are visually intuitive and can highlight market sentiment.

2.2 Trendlines and Support/Resistance Levels
The next critical concept in technical analysis is the identification of trends. A trend refers to the general direction in which the market or a specific stock is moving. Prices tend to move in three types of trends:
- Uptrend: Prices are consistently rising.
- Downtrend: Prices are consistently falling.
- Sideways trend: Prices are moving within a range, neither going up nor down.
To identify trends, technical analysts often use trendlines—lines drawn on a chart that connect two or more price points and help visualize the direction of the trend. A support level is a price point at which a stock or asset has historically had difficulty falling below. A resistance level is the opposite: a price point at which the stock has trouble rising above.
Support and resistance levels are essential because they can act as psychological barriers, indicating potential turning points in the market.
2.3 Moving Averages
A moving average (MA) is one of the most commonly used indicators in technical analysis. It smooths out price data by creating a constantly updated average price over a specific period. Moving averages help investors identify trends by filtering out the “noise” from price fluctuations.
The two most common types of moving averages are:
- Simple Moving Average (SMA): The average of a stock’s closing prices over a set number of periods.
- Exponential Moving Average (EMA): A weighted moving average that gives more importance to recent price data, making it more responsive to price changes.
Moving averages are often used to identify trend direction. For example, when the price is above the moving average, it is considered an uptrend, and when the price is below the moving average, it indicates a downtrend.
2.4 Relative Strength Index (RSI)
The Relative Strength Index (RSI) is a momentum oscillator that measures the speed and change of price movements. It ranges from 0 to 100 and is used to identify whether an asset is overbought or oversold.
- An RSI above 70 indicates that an asset is overbought and may be due for a price correction.
- An RSI below 30 indicates that an asset is oversold and may be poised for a price rebound.
RSI is commonly used in combination with other technical indicators to spot potential buy or sell signals.
2.5 Moving Average Convergence Divergence (MACD)
The MACD is a trend-following momentum indicator that shows the relationship between two moving averages of a stock’s price. The MACD consists of three components:
- The MACD line: The difference between the 12-day EMA and the 26-day EMA.
- The signal line: A 9-day EMA of the MACD line.
- The histogram: The difference between the MACD line and the signal line, showing momentum.
When the MACD crosses above the signal line, it generates a bullish signal, and when it crosses below the signal line, it generates a bearish signal.
2.6 Volume Analysis
In technical analysis, volume refers to the number of shares or contracts traded in a given time period. Volume is a crucial indicator because it can confirm the strength of a price trend. A price movement accompanied by high volume is considered more reliable than one with low volume.
For example, if a stock breaks above a resistance level with high volume, it indicates strong buying interest and suggests that the trend is likely to continue.
3. Identifying Stock Market Trends Using Technical Analysis
Now that we’ve covered some of the key tools and indicators in technical analysis, let’s discuss how to apply them to identify stock market trends. Predicting stock trends is about combining these indicators to form a broader view of the market.
3.1 Recognizing Trend Patterns
Technical analysts often look for chart patterns that indicate the direction of future price movements. Some common patterns include:
- Head and Shoulders: A reversal pattern that signals the end of an uptrend and the beginning of a downtrend.
- Double Top/Double Bottom: A reversal pattern that signals a potential change in trend direction.
- Triangles: Continuation patterns that suggest a stock will continue in the direction of the previous trend after a period of consolidation.
By learning to recognize these patterns, you can gain insights into the future direction of the market or a particular stock.
3.2 Combining Indicators for a Clear Signal
While individual indicators can provide useful insights, they are often more powerful when used in combination. For example, if a stock is in an uptrend (confirmed by a moving average) and the RSI is below 70, it may be a good indication that the stock is still in a healthy trend and not overbought. Conversely, if the stock is in an uptrend but the RSI is above 70, it may be a sign of an overbought condition and a potential price pullback.
Similarly, if a stock’s price breaks above resistance, and the MACD confirms this move with a bullish crossover, it strengthens the case for a continuation of the trend.
3.3 Setting Entry and Exit Points
One of the primary goals of technical analysis is to identify the optimal times to enter or exit the market. By using a combination of trend indicators, support and resistance levels, and momentum indicators like the MACD or RSI, you can pinpoint ideal buy and sell points.
For example, you might decide to enter a trade when the stock’s price breaks above resistance, confirmed by high volume, and the MACD crosses above the signal line. Similarly, you might set a stop-loss order just below a key support level to minimize risk in case the trade goes against you.

4. Practical Advice for Using Technical Analysis in 2024
While technical analysis can be a powerful tool for predicting market trends, it’s important to remember that no method is foolproof. Markets are influenced by a wide variety of factors, including economic data, geopolitical events, and investor sentiment. Therefore, it’s essential to approach technical analysis with caution and combine it with other methods of analysis, such as fundamental analysis and macroeconomic considerations.
In 2024, there are also new tools and resources that can help you stay ahead of market trends:
- Websites like TradingView and StockCharts provide powerful charting tools and community-driven insights.
- Investing.com and Yahoo Finance offer real-time data, stock analysis, and news, which are essential for making timely decisions.
- MetaStock and TradeStation are robust platforms that offer advanced technical analysis software for serious traders.
Lastly, remember that practice is key. By analyzing charts, practicing on paper, and using demo accounts, you can sharpen your skills and improve your ability to predict stock market trends.
Predicting stock market trends through technical analysis is both an art and a science. By understanding the key tools, indicators, and chart patterns, you can gain valuable insights into market behavior. However, it’s important to remember that technical analysis is not a crystal ball—it’s a probabilistic tool. With the right knowledge and a disciplined approach, you can increase your chances of making successful trades and positioning yourself for long-term success.
In 2024, as the market continues to evolve, technical analysis remains an essential component of an investor’s toolkit. With the right resources and continuous practice, you can harness the power of technical analysis to make more informed, confident investment decisions.


