
As an investor, understanding how to evaluate a company’s financial health is one of the most crucial skills you can develop. In today’s market, there are countless investment opportunities, but without the right analytical framework, you might be investing blindly. When you are choosing which stocks to buy, knowing how to analyze a company’s financial condition is the key to making informed decisions and building a profitable portfolio.
In this article, I’ll walk you through the essential methods for evaluating a company’s financial health. By the end of this guide, you will have a clear understanding of how to use financial statements, key financial ratios, and market indicators to assess a company’s strengths and weaknesses. Whether you’re a beginner or have some experience, these tools will help you make more confident decisions and minimize risk in your portfolio.
Why Financial Health Matters for Investors
When I first started investing, I was overwhelmed by the sheer number of companies and stocks to choose from. It was easy to fall into the trap of making decisions based on hype or fleeting news headlines. But as I became more experienced, I realized that the financial health of a company should be the bedrock of any investment decision.
A company’s financial health is an indicator of its ability to generate profit, manage debt, grow over time, and weather economic downturns. Strong financial health generally correlates with more stability, less volatility, and better potential for long-term growth. On the other hand, companies with poor financial health may face difficulties in paying off debts, generating sustainable profits, or expanding their operations. In such cases, their stock prices can be subject to significant swings or even a complete collapse.
The Financial Statements: Your Starting Point
Before diving into specific financial ratios and metrics, you need to understand the three main financial statements that provide insight into a company’s financial performance:
- The Balance Sheet – This provides a snapshot of a company’s financial position at a specific point in time. It lists the company’s assets, liabilities, and shareholders’ equity. By comparing a company’s assets with its liabilities, you can gauge its solvency and ability to pay off debts.
- The Income Statement (Profit & Loss Statement) – This shows a company’s profitability over a specific period, detailing revenues, expenses, and net income. By analyzing the income statement, you can understand how well a company manages its operations, the cost structure, and whether it is generating consistent profits.
- The Cash Flow Statement – This reveals how a company generates and uses cash. It is crucial to understand a company’s liquidity and its ability to maintain operations, make investments, and service its debts.
While these three statements are interconnected, they each provide a unique perspective on the company’s financial health. Let’s look at how to use these tools effectively.
Key Financial Ratios for Evaluating a Company’s Financial Health
Once you understand the basics of financial statements, it’s time to dig deeper. Financial ratios are the metrics that will allow you to interpret the information presented in these statements and make decisions based on that data. Below are some of the most important financial ratios that can give you insights into a company’s overall health.
1. Liquidity Ratios: Is the Company Financially Stable?
Liquidity ratios assess a company’s ability to meet short-term obligations. These are critical because even profitable companies can fail if they don’t have enough cash or liquid assets to cover their immediate expenses.
- Current Ratio
The current ratio is calculated by dividing a company’s current assets by its current liabilities. It gives a snapshot of whether a company can pay its short-term obligations with its short-term assets. A current ratio above 1 typically means the company is in a healthy liquidity position. However, a ratio significantly above 1 might indicate that the company isn’t efficiently using its assets. - Quick Ratio (Acid-Test Ratio)
The quick ratio is similar to the current ratio, but it excludes inventory from current assets, considering only assets that can be quickly converted to cash. It’s a more stringent test of a company’s liquidity position. A quick ratio of 1 or higher is typically considered good.
2. Profitability Ratios: How Well is the Company Generating Profits?
Profitability ratios give you an idea of how effectively a company is turning revenue into profits.
- Gross Profit Margin
This ratio shows how much money a company makes after subtracting the costs of producing its goods or services. A high gross profit margin indicates that the company is good at controlling its direct costs. You can calculate it by dividing gross profit by total revenue. - Operating Profit Margin (EBIT Margin)
This is the ratio of operating income to revenue. It reveals how much profit a company makes from its core operations, excluding interest and taxes. A higher margin indicates better efficiency in managing operational costs. - Net Profit Margin
This ratio shows the percentage of revenue that translates into profit after all expenses, taxes, and interest are accounted for. A higher net profit margin means a company is more efficient at converting revenue into actual profit.
3. Efficiency Ratios: How Efficiently is the Company Using Its Assets?
Efficiency ratios are essential for understanding how well a company is utilizing its assets to generate revenue.
- Return on Assets (ROA)
This ratio measures how much profit a company is generating for each dollar of assets. ROA is a good indicator of how well a company is utilizing its assets to produce earnings. A higher ROA indicates more efficient use of assets. - Return on Equity (ROE)
ROE measures how effectively a company is using shareholders’ equity to generate profits. It’s one of the most critical ratios for investors because it shows how well the company is creating value for its shareholders. A higher ROE often signals strong management and high profitability. - Asset Turnover Ratio
This ratio measures how efficiently a company uses its assets to generate sales. A higher ratio indicates that the company is efficiently using its assets to produce revenue.
4. Debt Ratios: How Much Debt is the Company Carrying?
Debt ratios help you assess the company’s leverage and ability to meet its debt obligations. Excessive debt can be a risk factor, especially if the company faces declining revenues or rising interest rates.
- Debt-to-Equity Ratio (D/E)
The D/E ratio compares a company’s total debt to its shareholders’ equity. A high D/E ratio may indicate that a company is overly reliant on debt to finance its operations, which could be risky if the market turns downward. - Interest Coverage Ratio
This ratio measures a company’s ability to meet its interest obligations on debt. It is calculated by dividing operating income by interest expenses. A ratio below 1.5 is a red flag, as it suggests the company might struggle to cover its debt interest payments.
5. Market Valuation Ratios: How is the Market Valuing the Company?
Market valuation ratios give insights into whether a company’s stock is overvalued or undervalued relative to its earnings, assets, or sales.
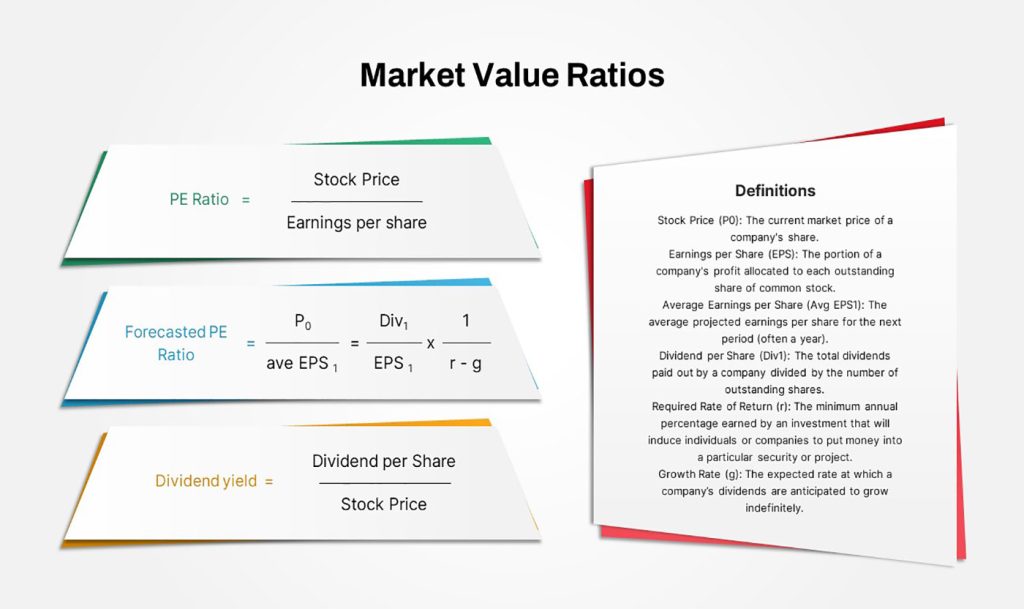
- Price-to-Earnings (P/E) Ratio
The P/E ratio is one of the most commonly used metrics to evaluate the valuation of a company. It’s calculated by dividing the stock price by the earnings per share (EPS). A high P/E ratio suggests that the market expects high future growth, while a low P/E could indicate that the stock is undervalued or that the company is in trouble. - Price-to-Book (P/B) Ratio
The P/B ratio compares the company’s market value to its book value (net asset value). A P/B ratio under 1 can indicate that the stock is undervalued, while a ratio above 1 suggests the market values the company more highly than its assets. - Dividend Yield
For income investors, the dividend yield is an important metric. It’s calculated by dividing the annual dividend payment by the stock price. A high dividend yield can be attractive, but it’s important to ensure that the company is paying sustainable dividends.

6. Additional Tools for Stock Analysis
To dig deeper into a company’s financial health, there are a number of financial data websites and platforms that I rely on to get the latest data and insights. Here are a few recommended ones:
- Morningstar (morningstar.com): A comprehensive site for research on stocks, mutual funds, and ETFs, providing detailed financials, ratings, and investment analysis.
- Yahoo Finance (finance.yahoo.com): A free resource offering a wealth of financial news, data, and analysis, including historical financial statements and market charts.
- Seeking Alpha (seekingalpha.com): Known for its in-depth articles, earnings analysis, and stock ideas from investors and experts.
- Bloomberg (bloomberg.com): For real-time financial news and data, Bloomberg offers comprehensive reports on financial markets and corporate performance.
- The Motley Fool (fool.com): A great resource for investment advice, stock recommendations, and news.
Putting It All Together
Evaluating a company’s financial health is not about memorizing ratios or blindly following one metric. It’s about understanding how different pieces of the financial puzzle fit together to give a full picture of the company’s performance, potential risks, and growth prospects. By mastering these tools and techniques, you’ll be better equipped to analyze stocks and make smarter investment decisions.
Ultimately, the goal is not to predict the future but to equip yourself with the knowledge to make informed decisions and react appropriately when circumstances change. With this approach, you can build a more resilient and profitable investment portfolio.


