In 2024, the world of investing continues to evolve at a rapid pace, and stock research has become more sophisticated than ever. Whether you’re a beginner just dipping your toes into the stock market or an experienced investor aiming to refine your strategies, mastering the art of stock research is essential. The more informed your decisions, the more likely you are to achieve success in the long run.
Stock research involves more than just reading headlines or trusting the latest buzz on social media. It’s about digging into company fundamentals, understanding market trends, and utilizing the right tools to make data-driven decisions. In this article, I’ll walk you through the various methods and tools that can help you conduct effective stock research and make smarter investment decisions.
1. Why Stock Research Matters
Before we dive into the methods and tools, let’s briefly discuss why stock research is so critical.
Investing in stocks is not a gamble, and if you treat it as such, you’re likely to experience frustration and losses. Research gives you a structured approach to evaluate the potential of a company, the risks involved, and whether a stock is fairly priced. Here are some key reasons why stock research is essential:
- Risk Mitigation: Research helps you identify potential red flags, such as companies with unsustainable debt or questionable business models, reducing the chances of making poor investment choices.
- Long-Term Success: Investors who research their stocks thoroughly are more likely to build a profitable and well-balanced portfolio over time.
- Confidence in Decision-Making: Research gives you the confidence to hold onto your investments during volatile periods, knowing that you’ve made well-informed decisions.
With these benefits in mind, let’s explore the methods and tools that can aid in your research.
2. Understanding the Key Components of Stock Research
Stock research can generally be broken down into two primary categories: fundamental analysis and technical analysis. Each of these methods focuses on different aspects of a stock’s performance, but both are crucial in making an informed decision.
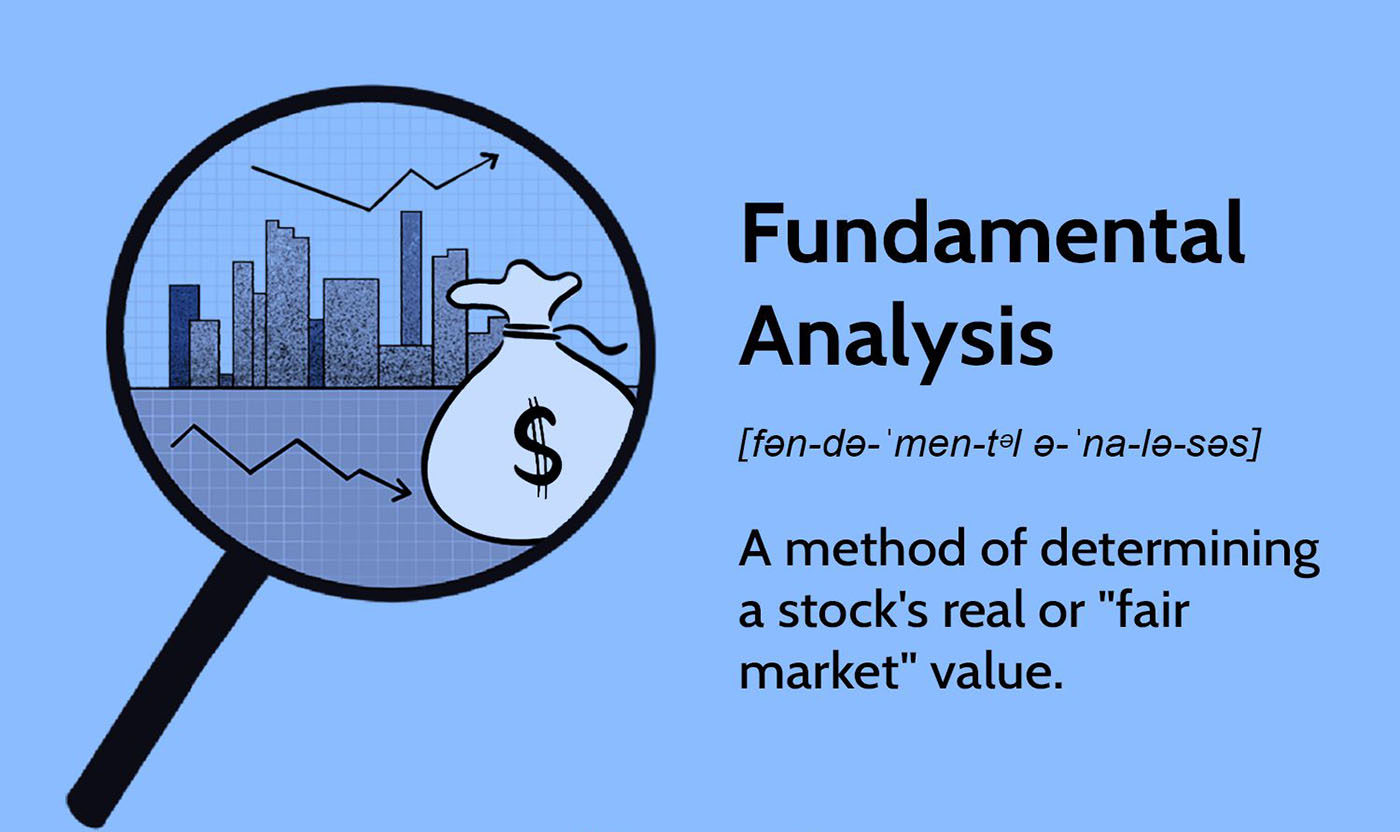
Fundamental Analysis
Fundamental analysis involves looking at the underlying health of a company, evaluating factors like its earnings, growth potential, debt levels, and competitive advantages. This method is often used for long-term investing.
Key factors in fundamental analysis include:
- Earnings Reports: Quarterly and annual earnings reports provide insight into how a company is performing. Look for revenue growth, net income, and earnings per share (EPS).
- Financial Ratios: Ratios like the price-to-earnings (P/E) ratio, price-to-book (P/B) ratio, and return on equity (ROE) are key metrics in evaluating a company’s financial health.
- Growth Potential: Is the company growing? Are they entering new markets, or introducing new products that could spur future growth?
- Competitive Advantage: Does the company have a unique product or service that gives it a competitive edge in its industry?

Technical Analysis
On the other hand, technical analysis focuses on past price movements and trading volume to predict future stock movements. This method is typically used by short-term traders, but it can also be helpful for long-term investors who want to time their entries and exits.
Key aspects of technical analysis include:
- Price Trends: Understanding whether a stock is in an uptrend, downtrend, or moving sideways.
- Chart Patterns: Recognizing patterns like head and shoulders, double tops, or triangles can help predict future price movements.
- Volume Analysis: Analyzing trading volume helps confirm the strength of a price move. High volume during an uptrend could suggest that the trend is strong and likely to continue.
- Indicators and Oscillators: Technical indicators such as moving averages, Relative Strength Index (RSI), and MACD can provide further insights into stock trends.
Both of these research methods are important, but many investors combine the two approaches for a more well-rounded understanding of a stock.
3. How to Use Financial Reports for Research
Financial statements are the backbone of fundamental analysis. Companies must file reports regularly, and these are publicly available to investors. As an investor, understanding how to read and analyze these reports is crucial.
Key Reports to Review:
- Income Statement: This shows a company’s revenues, expenses, and profits over a specific period. Pay close attention to revenue growth, net income, and margins.
- Balance Sheet: The balance sheet provides an overview of a company’s assets, liabilities, and equity. Look for healthy debt levels and sufficient assets to cover liabilities.
- Cash Flow Statement: This statement shows how money moves in and out of the business. Strong positive cash flow is a good indicator of financial health, while negative cash flow could be a red flag.
Many tools and websites can help you interpret these reports, such as Morningstar and Yahoo Finance, both of which provide detailed financial data, ratio analysis, and earnings reports.
Check out Morningstar here: www.morningstar.com
4. The Role of News and Sentiment Analysis
Stock research is not just about numbers. In today’s fast-moving market, news and sentiment can have a profound impact on stock prices. Positive news can cause stocks to soar, while negative news can send them plummeting.
How to Track News Effectively:
- Earnings Calls: Listening to or reading transcripts of earnings calls is one of the best ways to hear directly from company executives about the company’s performance, future plans, and market conditions.
- Press Releases: Companies regularly issue press releases about new product launches, partnerships, or other significant developments. Keeping an eye on these can provide early insights into upcoming stock movements.
- Market Sentiment: Using social media platforms like Twitter, Reddit (particularly the r/stocks and r/investing subreddits), and financial blogs, you can get a sense of the broader market sentiment surrounding a company.
Platforms like Seeking Alpha are excellent for reading analysis and opinions from both professionals and retail investors.
Check out Seeking Alpha here: www.seekingalpha.com
5. Using Stock Screeners for Efficient Research
Stock screeners are one of the most powerful tools available for investors. A stock screener allows you to filter stocks based on specific criteria, such as earnings growth, dividend yield, or market cap. This helps you narrow down your options and focus on stocks that meet your investment goals.
Some excellent stock screeners include:
- Yahoo Finance Stock Screener: Yahoo Finance offers a free stock screener that allows you to filter stocks based on a wide range of criteria. It’s simple to use and ideal for beginners.
- Finviz: Finviz is another popular screener, offering both free and premium versions. The premium version includes advanced filters, real-time data, and more detailed charts.
- Stock Rover: Stock Rover provides a comprehensive screener that includes over 500 metrics, as well as a wealth of other tools to help you with portfolio management and stock research.
By using a stock screener, you can filter out stocks that don’t meet your criteria and focus on those with the most potential.
Explore Stock Rover here: www.stockrover.com
6. Charting and Technical Indicators
Once you’ve narrowed down your list of stocks, it’s time to analyze them using charting tools and technical indicators. A stock chart gives you a visual representation of a stock’s historical price movements, which can help you make more informed decisions about when to buy or sell.
Some of the best charting tools include:
- TradingView: Known for its powerful charting features, TradingView provides a wide range of indicators and drawing tools, allowing you to analyze stock movements in detail. It’s a must-have for those who rely heavily on technical analysis.
- ThinkorSwim: A free platform from TD Ameritrade, ThinkorSwim provides an extensive set of charting and technical analysis tools, as well as paper trading features, to help you practice and refine your strategies.
With these platforms, you can overlay technical indicators like moving averages, RSI, and MACD to analyze trends, spot buy and sell signals, and better time your trades.
Check out TradingView here: www.tradingview.com
7. Staying Updated with Real-Time Data and Alerts
Real-time data and alerts are crucial in today’s fast-paced market. Being able to monitor your stocks and receive notifications on important events—whether it’s a significant price change, earnings announcement, or breaking news—gives you an edge over other investors.
Platforms like Yahoo Finance and Google Finance allow you to create personalized watchlists and set alerts for specific stocks or price points. Additionally, Robinhood and Fidelity offer built-in notifications for major stock movements.
Check out Yahoo Finance for real-time updates here: www.finance.yahoo.com

8. Making the Decision: Putting It All Together
The final step in stock research is making a well-informed decision. After analyzing a company’s fundamentals, understanding the market sentiment, utilizing technical indicators, and staying updated on real-time data, you should have a clear understanding of whether a stock fits into your investment strategy.
Remember that investing is not about perfect predictions; it’s about making educated decisions based on the information you have at hand. Always consider your risk tolerance and long-term goals before making a purchase.
The Power of Knowledge
Stock research is an essential part of successful investing. By combining both fundamental and technical analysis, utilizing financial reports, staying updated with news, and using powerful tools like stock screeners
and charting platforms, you’ll be in a strong position to make informed, confident investment decisions.
While it might seem overwhelming at first, with practice, you’ll find your rhythm and develop a research process that works for you. And most importantly, as you get more comfortable with these tools and techniques, you’ll start to see the value they bring to your investment strategy.
Happy researching, and may your investment journey be fruitful!


